KOM – Key Operational Metrics

Key Operational Metrics

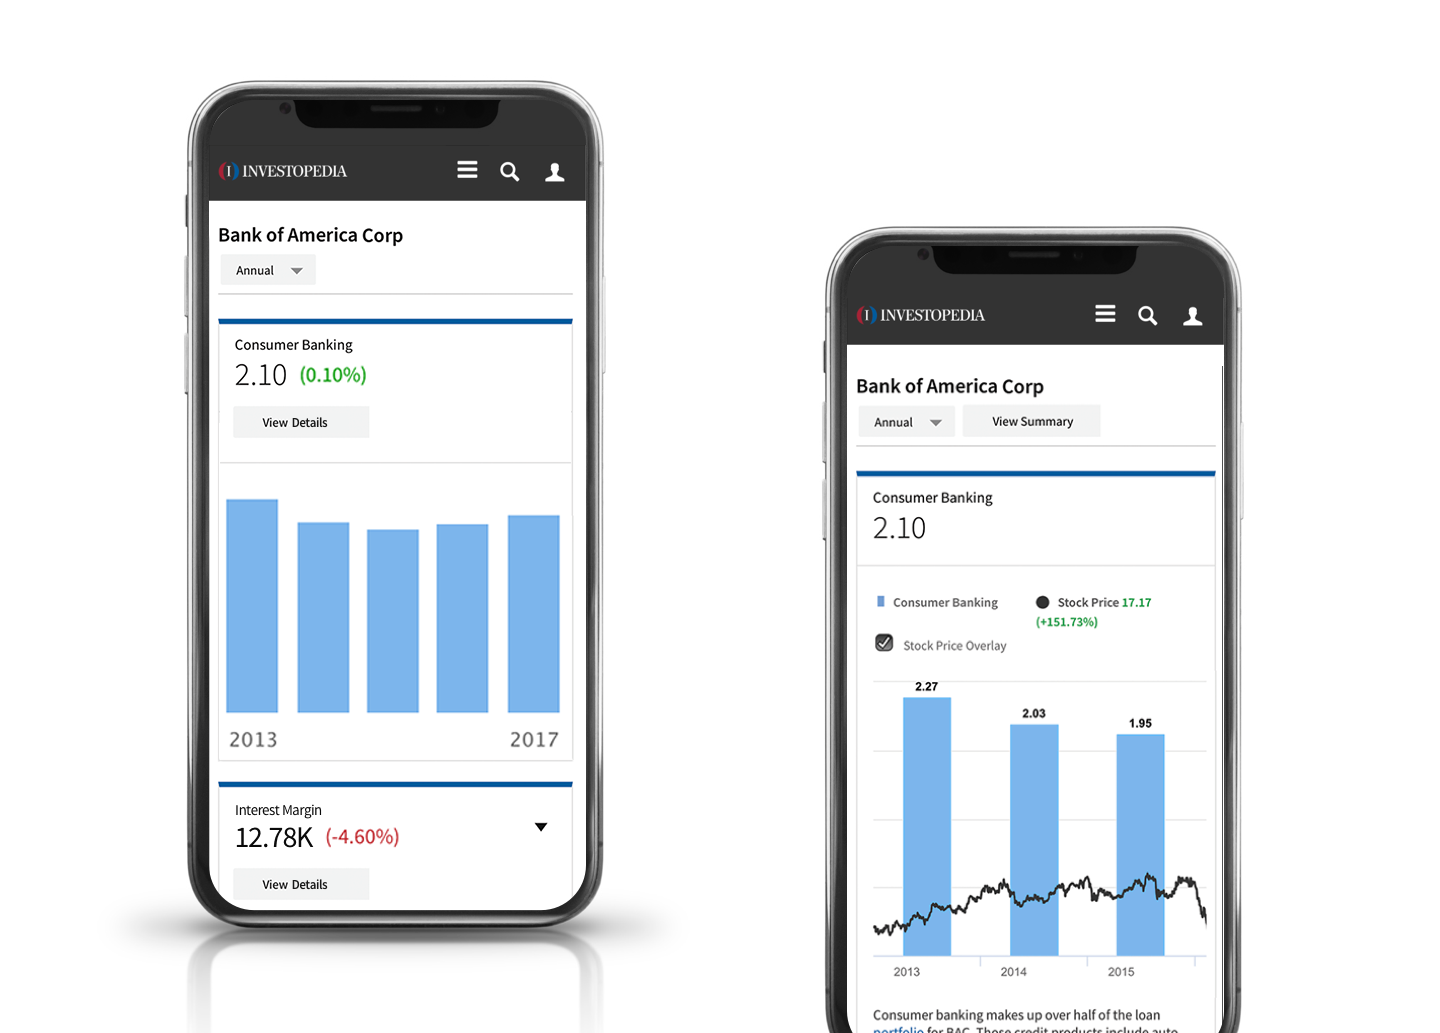
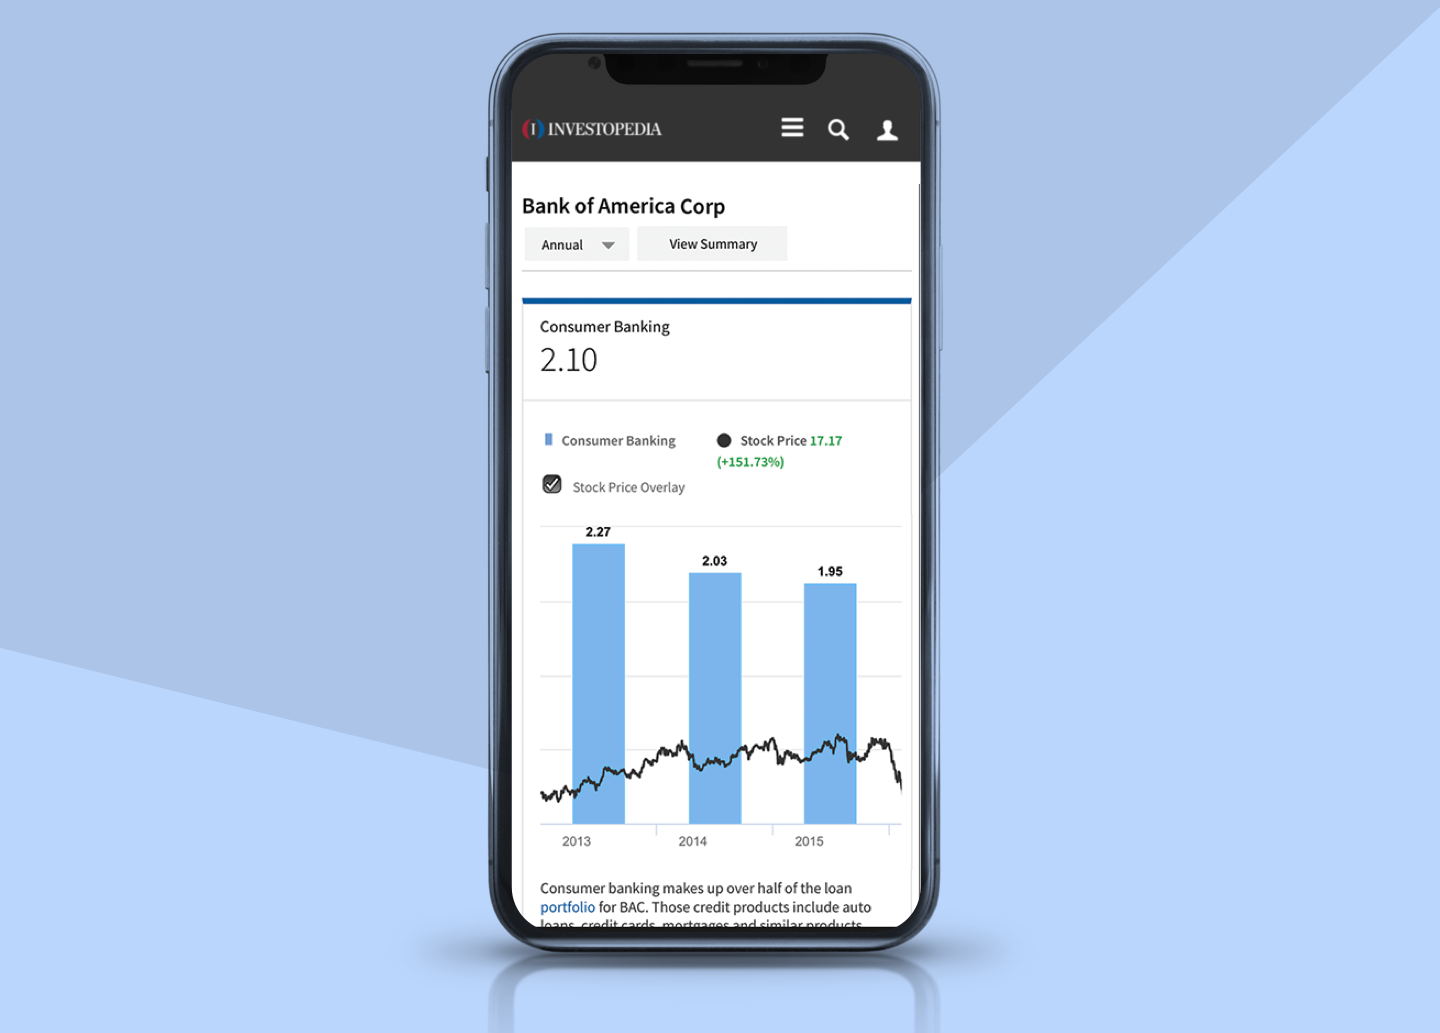
There’s more to evaluating a company’s financial performance than just looking at P/E ratio. Each company has its own unique success metrics tied to its specific business model for achieving its strategic and operational goals. For Apple that may mean iPhone sales, and for Netflix it may mean number of subscribers.

Understanding key performance indicators has traditionally been the purview of fund managers and analysts, but would be a powerful tool for students and novice investors if made available on a public platform. As the core mission of Investopedia has always been to democratize financial education, it made perfect sense to be first in this space.

My Role:

  • Product Design Lead

    On this project, my design team consisted of a Sr. Product Designer, UX Designer, and a UI/Front-end Developer. We collaborated closely with the Markets product GM, Product Manager, Dev Team, and several data scientists and stock analysis experts. From the beginning, we knew this would be a big project with unique complexities and exciting opportunities.
    I was responsible for guiding the entire design process and ensuring that design solutions proposed by the team not only met the business requirements, but also provided value to our users.

    My role on this team was not limited to managing the design operations. I was happy to be directly involved with and contributing throughout the design process from brainstorming to delivery.

    To learn more about this project, request the in-depth case study.

  • User Research

    Our team enjoyed easy access to investment experts and novices alike for user research and iterative testing.

    We began with customer interviews to discover how to best present the data to visitors unfamiliar with company operational metrics. We were able to present rough design concepts and paper prototypes early on for feedback from our users, informing the design direction and helping us focus on key features.

    As the design solidified, we were able to test increasingly more interactive and high fidelity prototypes with users in person as well as through online user testing platforms.

  • UX Design

    Collaborating closely with the Product Manager and Development Team, the design team leveraged our understanding of our users as well as the technical limitations of our third-party javascript charting library.

    Through many ideation sessions and user feedback sessions, my team began designing and refining a user experience that would be instructive to novice and experienced investors, alike.

  • Responsive UI Design

    We wanted to ensure that the Key Operational Metrics product would be highly usable on all devices with the right level of complexity at each view port.

    Some data visualization features that made sense for a desktop experience were not necessarily appropriate for the mobile use context.

    The design team benefited from a talented UI/Frontend developer who was able to build interactive prototypes for different use cases. Through careful testing on a variety of devices, we designed a UI that was clear and easily digestible for users.

KOM Desktop1
KOM mobile
KOM Desktop2